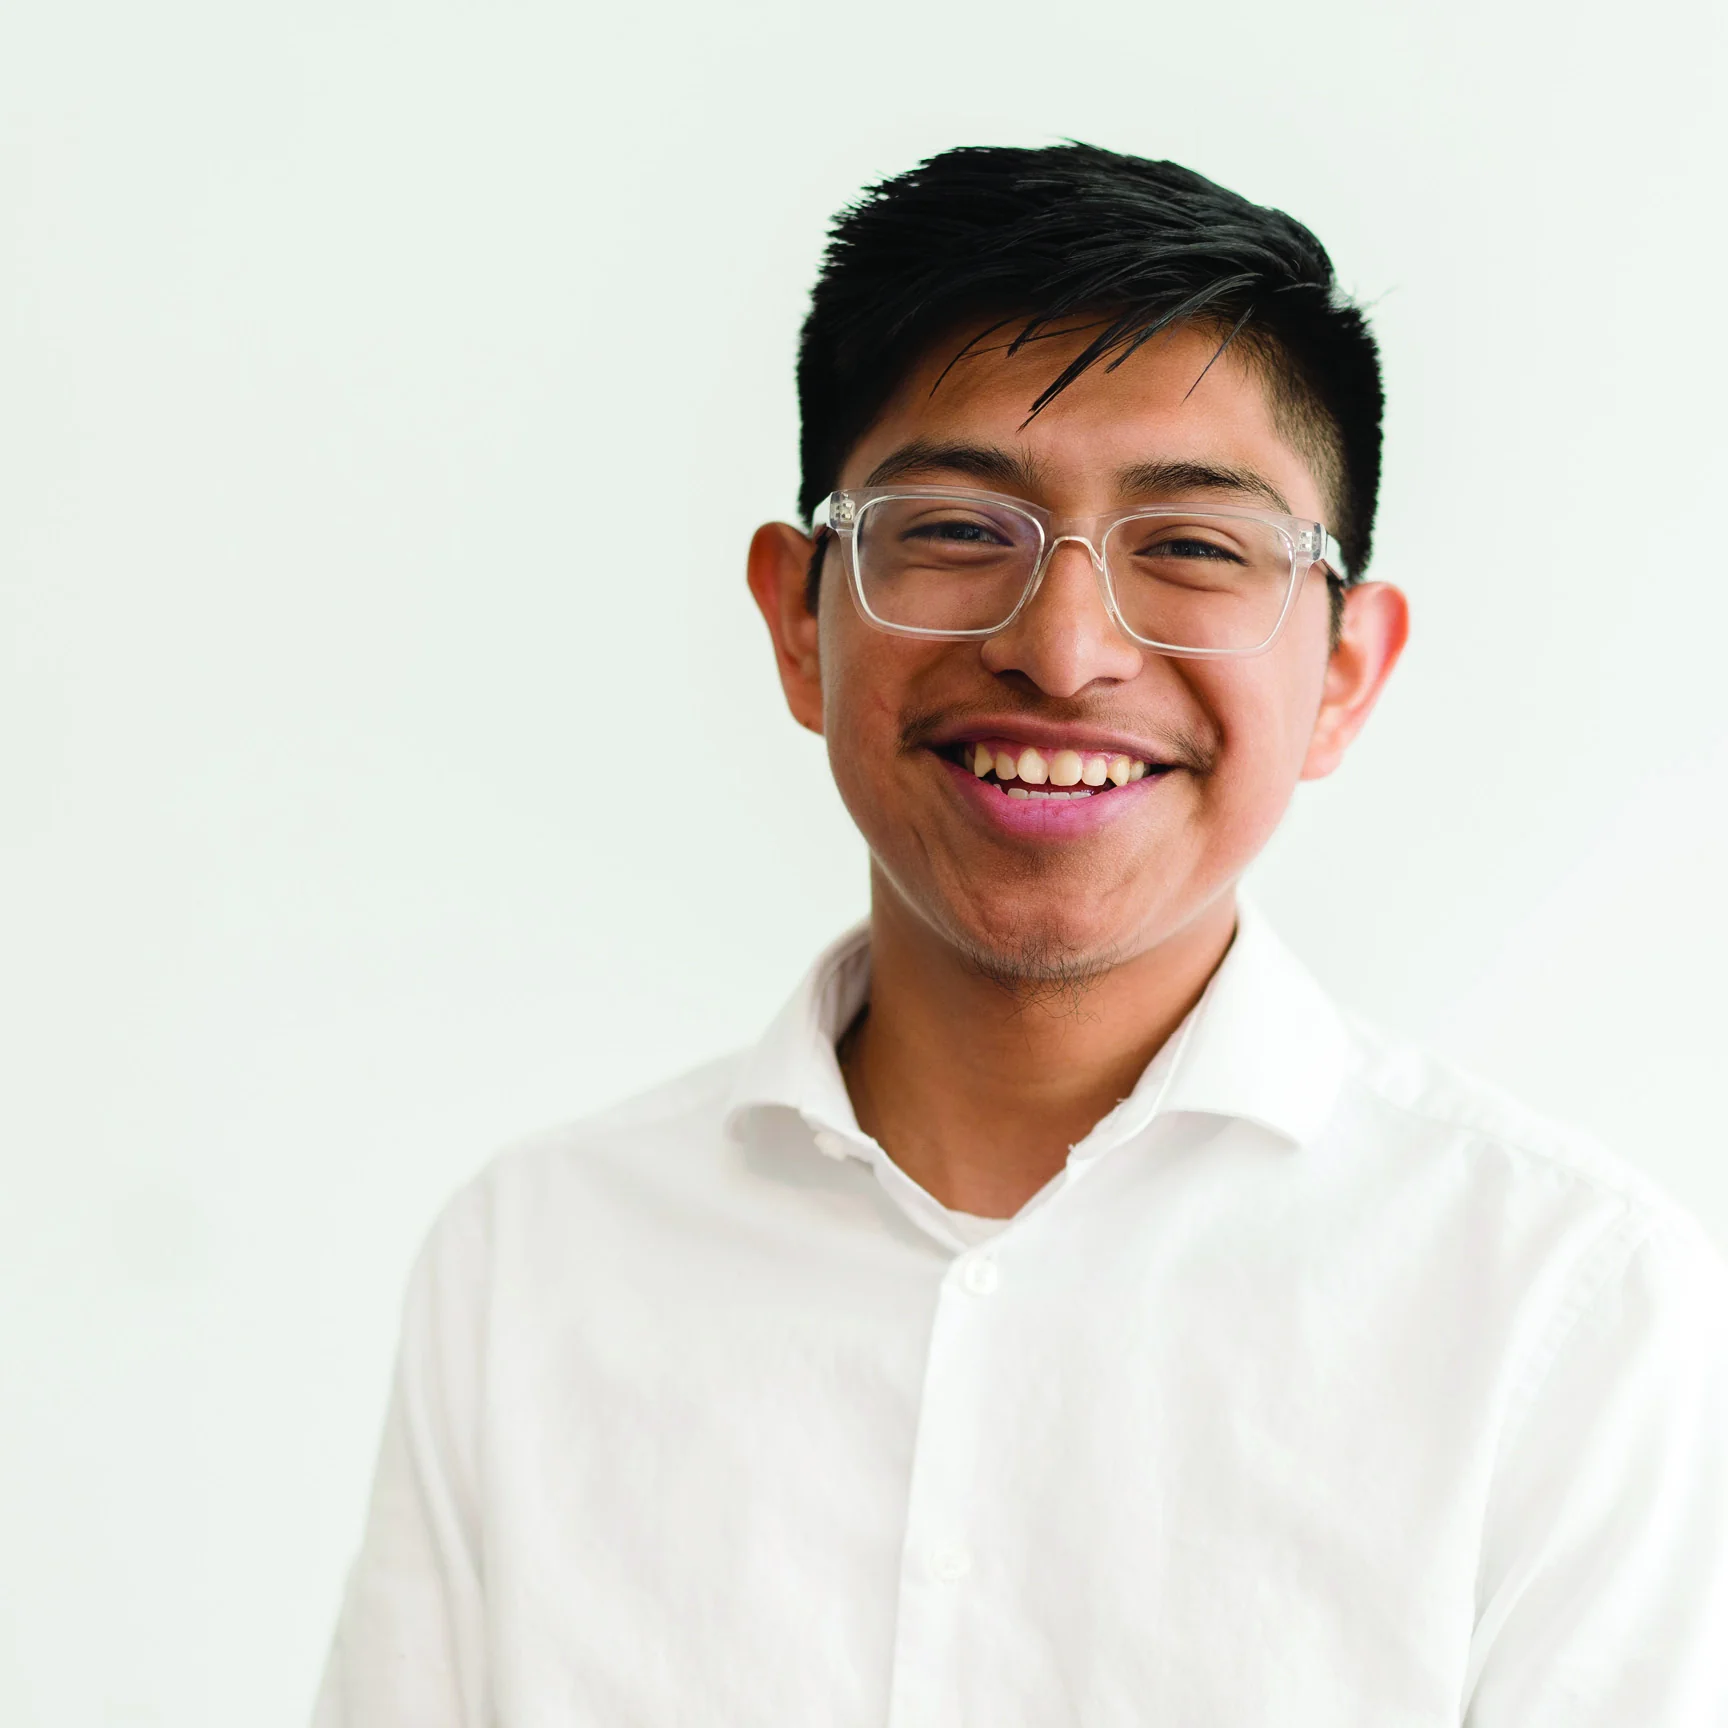

Fall 2023 Fellow
Abram Luna
Northwestern University
Trader Specialist, Charles Schwab
2026
Impact Report
2025-2026 School year
Together with our higher education and employer partners, we’re proving what’s possible when you empower the next generation of leaders with the skills, networks, confidence, and experience necessary to launch a strong career.


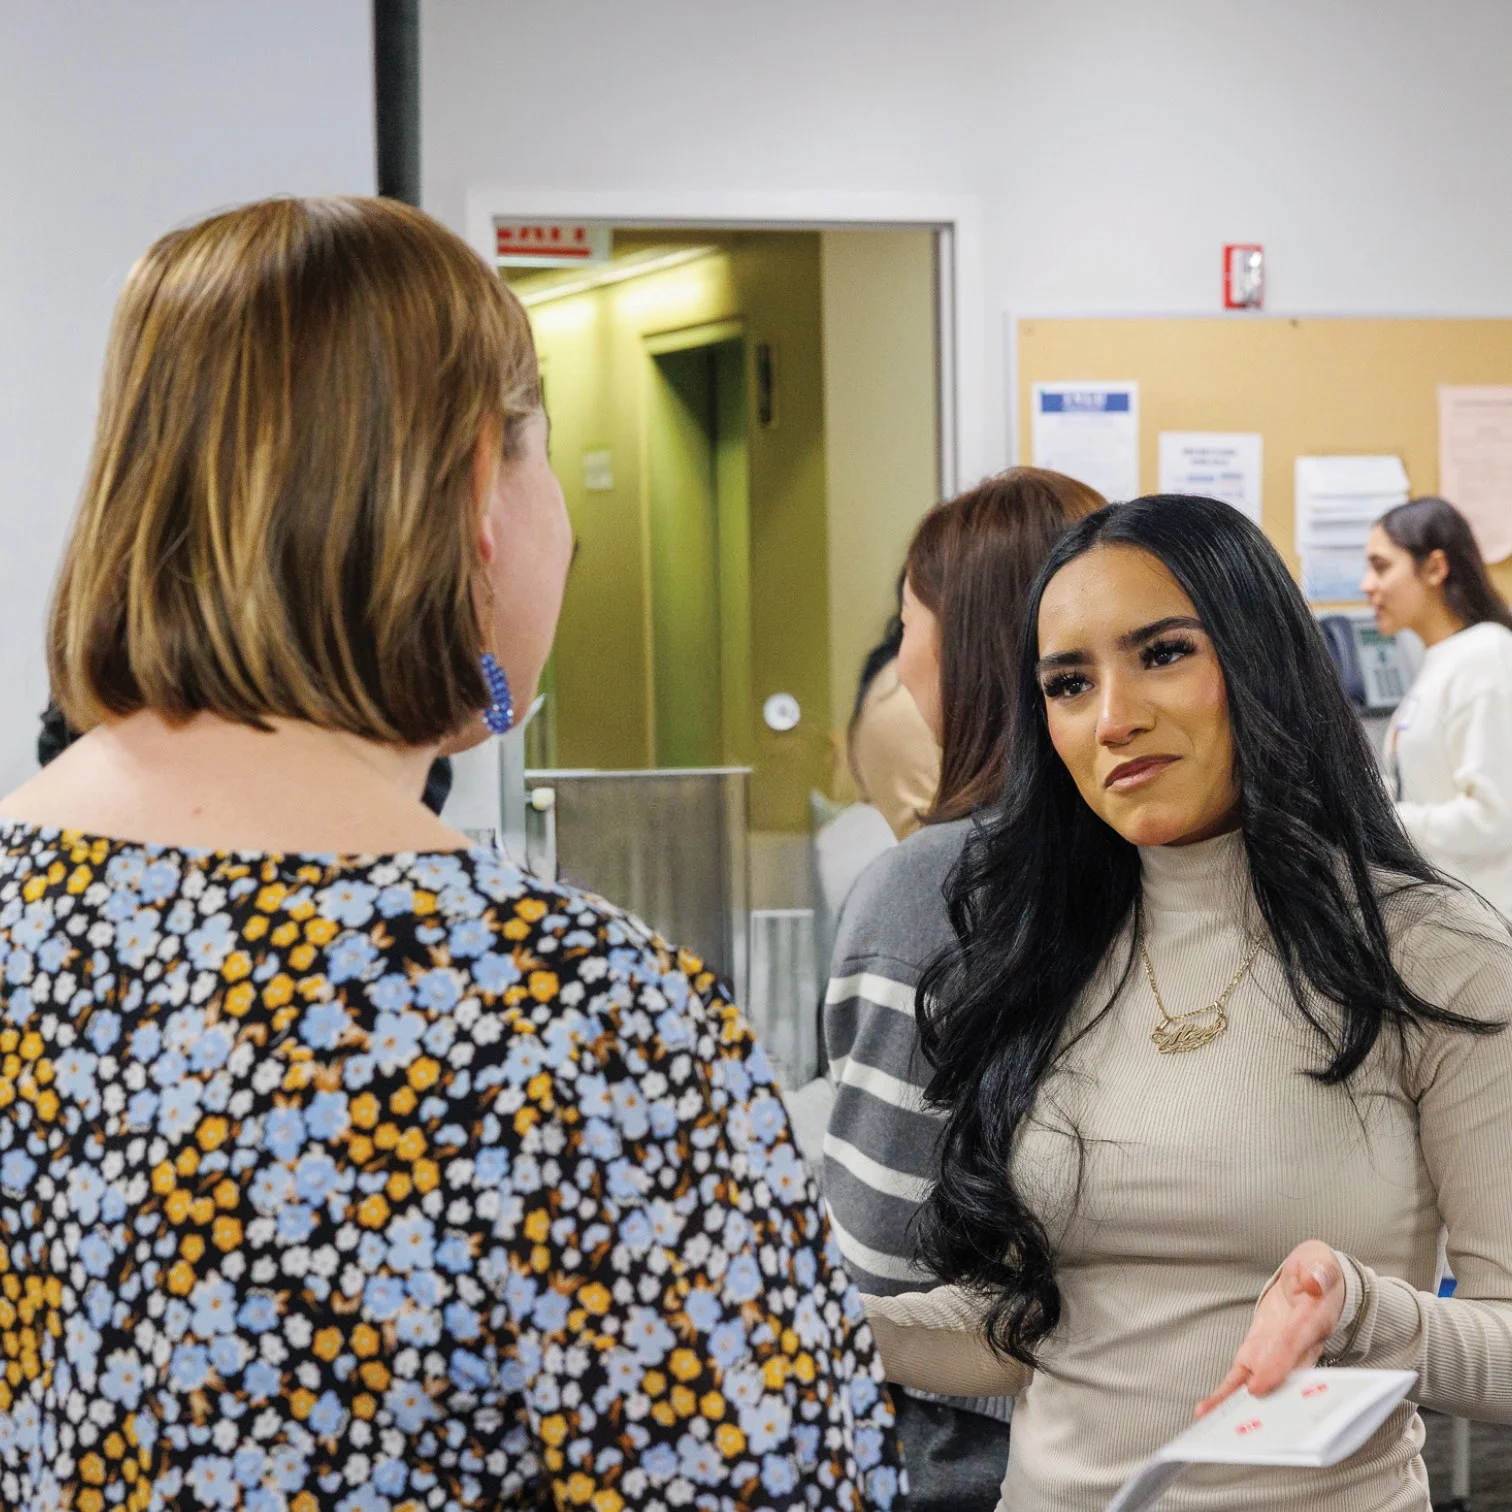
Chris Joyce
What does this report cover?
Across the country, Braven and our dedicated partners are turning the promise of economic mobility into reality, one Fellow at a time.
We're on a path to reach 80,000-100,000 students by 2032, at which point we'll welcome 25,000 new Fellows annually into a proven model that builds the career-readiness skills, networks, and experience that careers are built on.
To date, more than 17,000¹ Fellows have come through Braven's doors, and the momentum is only growing. This report takes a close look at what that momentum means in practice, through the lens of five questions that get to the heart of our work:
Why our work matters
Only about one quarter of the low-income or first-generation college students who enroll in college each year will graduate and secure a strong first job or enroll in graduate school.²

That’s about one million students every single year who aren’t on the path to the American Dream.

Mission
In collaboration with our higher education and employer partners, Braven empowers promising college students with the skills, networks, confidence, and experience necessary to transition from college to strong economic opportunities, which lead to meaningful careers and lives of impact.
Vision
The next generation of leaders will emerge from everywhere.
The Braven Equation
Braven provides career readiness experiences for students earning a four-year degree, ensuring students graduate ready to secure a strong first opportunity. The Braven Equation consists of four career-readiness factors—skills, networks, confidence, and experience—which add up to a career-ready college graduate.

The Braven Experience
Braven equips promising college students on their paths toward quality economic opportunities through a semester-long, cohort-based course—developed with input from our higher education partners and faculty, employer partners, volunteers, and students—and support that extends beyond the course, continuing through six months after college graduation.
In our core higher education model, students take the course for credit. Students who come through BravenX via college success organizations receive a financial stipend in lieu of credit.

Our Higher Education Partners




Launched Fall 2026

Launched Fall 2026




Launched Fall 2026


1
SECTION 1
Are our Fellows securing quality career outcomes that put them on the path to the American Dream?
National Statistics
National Statistics
Pursuing the bachelor’s degree is still the surest path to economic mobility
A bachelor’s degree holder is still employed at a higher rate, has greater job security once employed, and earns more than workers with a high school diploma alone.
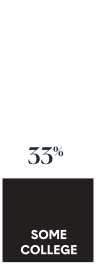
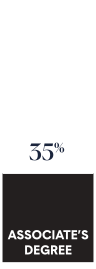
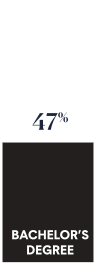
The bachelor’s degree remains a strong predictor of job quality.
Employees with a bachelor’s or graduate degree are more likely to have quality jobs than those with an associate’s degree, some college, or a high school education or less.³
Percentage of degree completers in quality jobs


Workers with a four-year degree earn 72% more than workers with a high school diploma alone.
Median Economic Outcomes
for Workers AgeS 25-54 with a Bachelor’s Degree ⁴

National Statistics
National Statistics
The opportunity: Translating degrees into career-launching opportunities
The challenge today is not the value of the degree itself, but ensuring students can successfully translate it into career-launching opportunities.
Although the long-term effects of AI on job availability are still emerging, its influence on the job search experience and hiring practices is already evident.
Increase in job applications
In June 2025, LinkedIn reported that the number of job applications increased by more than 45%, and the platform is clocking an average of 11,000 applications per minute.⁵
AI’s impact on job hunting
Twenty-six percent of candidates say AI has made it harder to stand out due to increased competition. Among Gen Z, that number jumps to 45%.⁵
Employers are prioritizing human skill competencies to distinguish the strongest entry-level candidates in an increasingly competitive applicant pool.
These include:⁶

Communication

Critical Thinking

Teamwork

Professionalism
These are closely aligned with the seven career-readiness skills Braven helps students develop in the Accelerator course:


BravenX Fellows secured quality opportunities after college
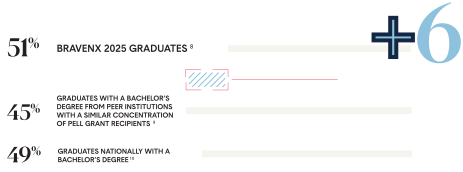
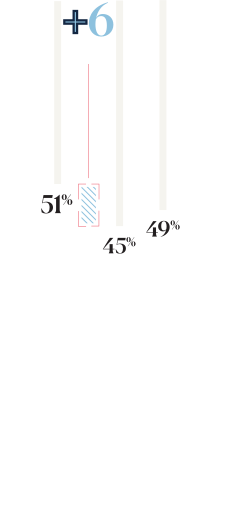
In 2025, 298 BravenX Fellows graduated from their colleges and universities nationwide. This new class is outpacing their peers nationally in quality outcome attainment⁷ by 6 percentage points (51% vs 45%) within six months of graduation.
BravenX Class of 2025 demographics
90%
students from
low-income backgrounds ¹¹
68%
first-generation college students ¹²
BravenX Class of 2025 demographics
90%
students from
low-income backgrounds ¹¹
68%
first-generation college students ¹²
HESS International Educational

The strength of roles that BravenX 2025 graduates secured
Of the 298 BravenX Fellows who graduated from college in 2025,
are employed or enrolled in graduate school


secured quality or pathway outcomes
2025 BravenX Graduates


HOW WE DEFINE QUALITY
ECONOMIC OPPORTUNITIES
a full-time role that requires a bachelor’s degree and includes some combination of promotion pathways, employee benefits, and a market-competitive starting salary, or enrollment in graduate school
a role that does not require a bachelor’s degree but helps students’ financial sustainability, is aligned with career interests, and will likely lead to more career-accelerating possibilities through skill development
a role that does not require a bachelor’s degree, offers limited runway to additional career-accelerating opportunities, and is not aligned with students’ career interests
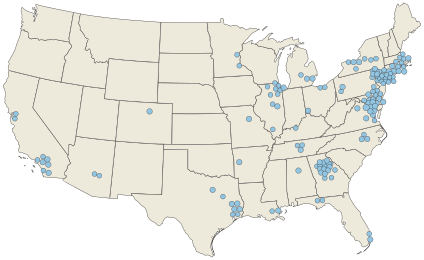
National Fellow enrollment in graduate school
Enrollment in graduate school is one of the ways Braven defines a quality outcome.
27%
of the 2025 graduates continued on to graduate school within six months of graduation.¹³
BROWSE THE MAP BY CLICKING THE ARROWS BELOW
Agnes Scott College
Alfred University
American University
Arizona State University
Augusta University
Aurora University
Bank Street College of Education
Barry University
Baruch College
Baylor University
Boston University
Brooklyn College
Brown University
California State University, Long Beach
Capella University
Carnegie Mellon University
Case Western Reserve University
Central Georgia Technical College
City University of New York
Clark Atlanta University
Columbia University
DePaul University
Drexel University
Duke University
Emory University
Emory University Nell Hodgson Woodruff School of Nursing
Emory University Rollins School of Public Health
Emory University School of Medicine
Faulkner University
Fisk University
Florida A&M University
Florida State University
George Washington University
Georgetown University
Georgetown University Law Center
Georgia College & State University
Georgia Institute of Technology
Georgia State University
Grand Canyon University
Harvard University
Howard University
Howard University School of Law
Hult International Business School
Illinois Institute of Technology
Illinois State University
Johns Hopkins University
Johns Hopkins University School of Medicine
Kean University
Kennesaw State University
La Sierra University
Lamar University
Lehman College
Loyola University Chicago
Massachusetts Institute of Technology
Meharry Medical College
Mercer University
Mercy University
Michigan State University
Mitchell Hamline School of Law
Montclair State University
Morehouse College
Morehouse School of Medicine
Morgan State University
National Louis University
New Jersey Institute of Technology
New York University
New York University Tisch School of the Arts
Newman University
Northeastern University
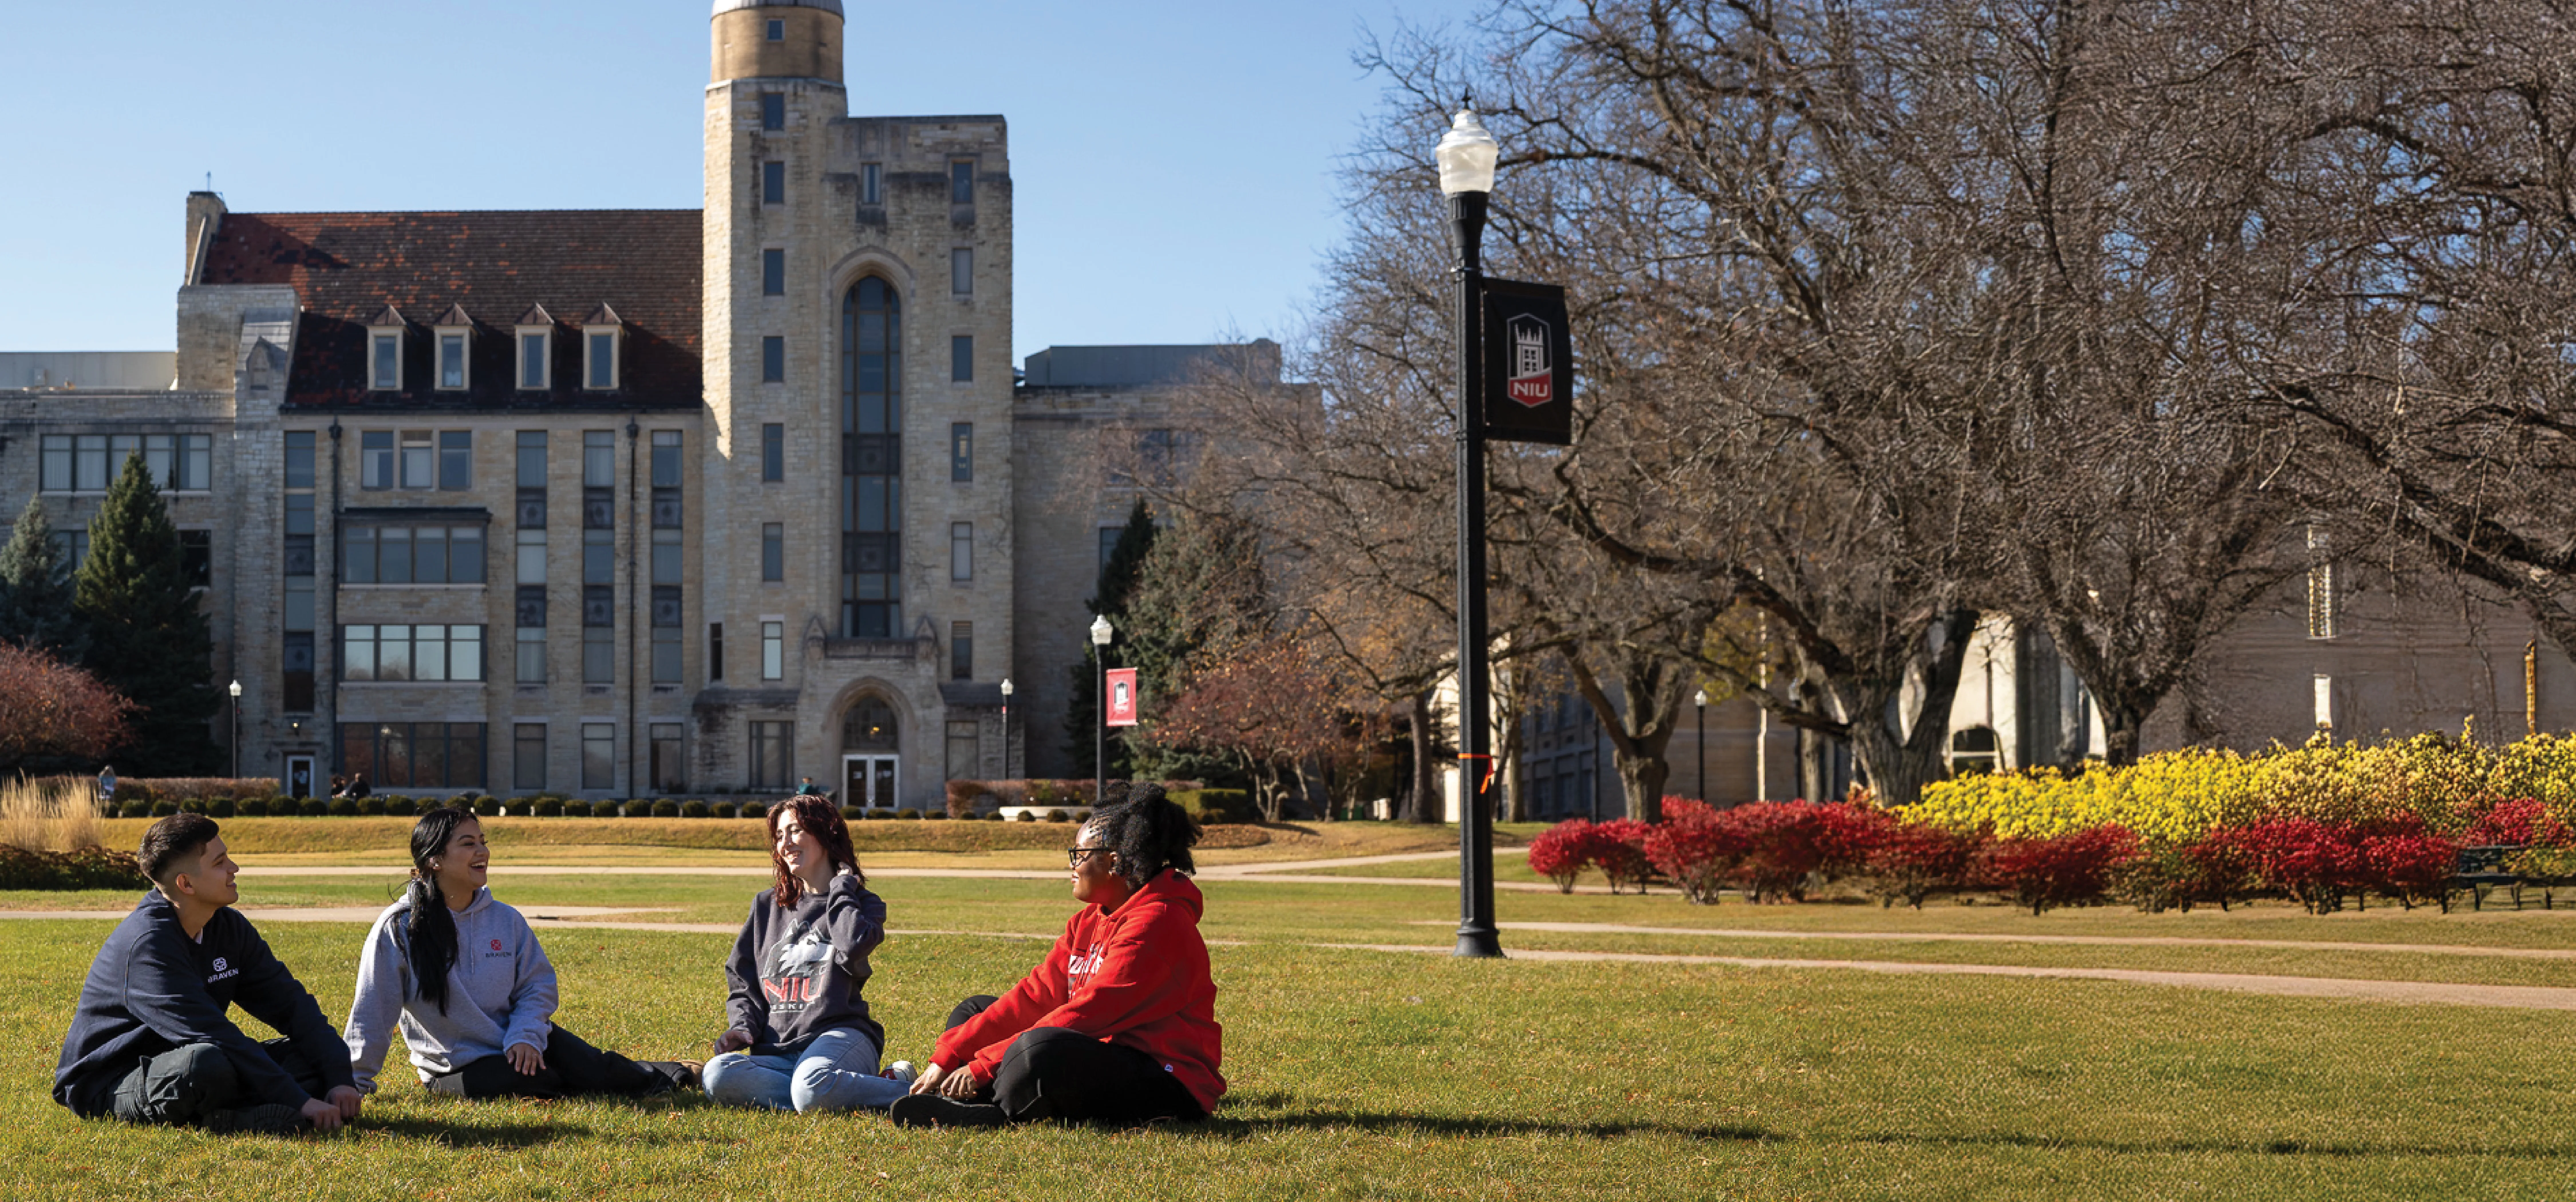
Northern Illinois University
Northwestern University
Old Dominion University
Palo Alto University
Philadelphia College of Osteopathic Medicine
Rensselaer Polytechnic Institute
Rice University
Russell Sage College
Rutgers Business School
Rutgers New Jersey Medical School
Rutgers School of Public Health
Rutgers University-New Brunswick
Rutgers University-Newark
Saint Joseph’s University Philadelphia College of Pharmacy
San Diego State University
San José State University
Savannah College of Art and Design
Seton Hall University
Seton Hall University School of Law
Sotheby’s Institute of Art
Southern Illinois University Carbondale
Southern University Law Center
Spalding University
State University of New York at Brockport
Stevens Institute of Technology
Stony Brook University
Syracuse University
Teachers College, Columbia University
Temple University
Texas Southern University
The City College of New York
Towson University
Tufts University
Tufts University School of Medicine
Tulane University
University of Alabama at Birmingham
University of Arkansas
University of California, Irvine
University of California, Los Angeles
University of California, San Diego
University of Cincinnati
University of Colorado Boulder
University of Connecticut
University of Delaware
University of Georgia
University of Houston
University of Houston Law Center
University of Illinois at Chicago
University of Illinois at Urbana-Champaign
University of Maryland
University of Maryland, Baltimore County
University of Massachusetts Boston
University of Miami
University of Michigan School of Public Health
University of Michigan, Ann Arbor
University of Missouri
University of Mount Saint Vincent
University of North Carolina Adams School of Dentistry
University of North Carolina at Chapel Hill
University of Pennsylvania
University of Pittsburgh
University of Rochester
University of Rochester School of Medicine and Dentistry
University of Southern California
University of Texas at Dallas
University of Texas Health Science Center at Houston
University of the District of Columbia
University of Virginia
Vanderbilt University
Virginia Commonwealth University
William & Mary
Yale Law School
Yale School of Public Health
Yale University
International schools
Alliance Manchester Business School
Imperial College London
King’s College
McGill University
Nanjing University
St. Matthew’s University
University of Kent
University of Manchester
University of Oxford
Illinois
- Aurora University
- DePaul University
Illinois selected


The Braven Equation in action
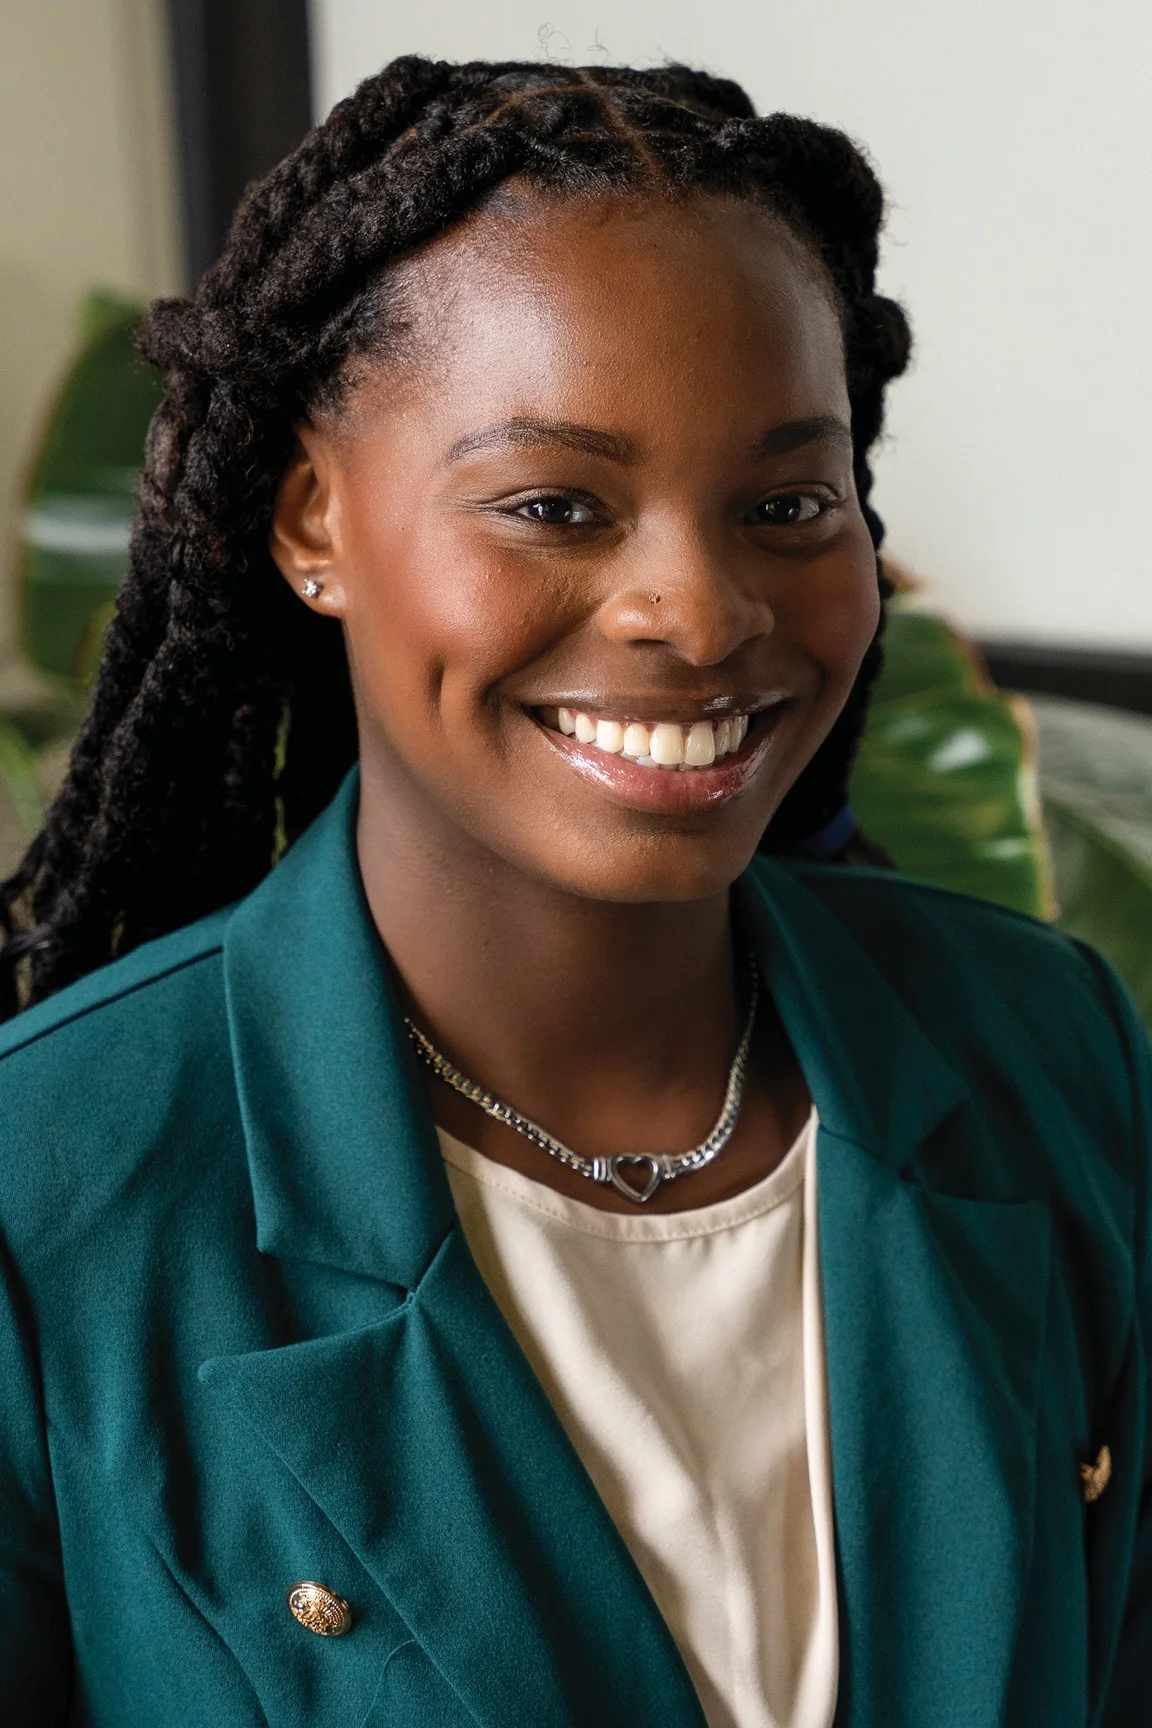
With Braven’s help, Brenda Thornton built the foundation to get on the path to the American Dream.

The Braven experience equipped Brenda with 7 key career competencies: career navigation • leadership • organization • communication • teamwork • problem solving • technology
Leadership Coach Henry Ollie, Senior Manager, BMO Harris Bank, provided Brenda with 60 hours of mentorship.
“BravenX gave me the tools to properly network and brand myself when talking to representatives of big companies. Their professional development, conferences, and mentorship programs were a major catalyst in my career acceleration!”
After the Braven course, Brenda secured a high-quality internship: Test and Evaluation Intern, Boeing

National Statistics
National Statistics
How the job market is shaping up for the Class of 2026
The picture for the Class of 2026 is more nuanced than the headlines suggest. Hiring projections have turned upward and more graduates are finding work more quickly, but unemployment remains elevated.
Encouraging signs for the Class of 2026
Employers project hiring for the Class of 2026 to be up 5.6% compared to last year, according to the spring update from the National Association of Colleges and Employers.¹⁷
Top industries hiring: ¹⁵

Information

Engineering Services

Wholesale Trade

Construction

Miscellaneous Professional Services
Top 5 industries decreasing hiring: ¹⁵

Utilities

Computer & Electronics Manufacturing

Miscellaneous Manufacturing

Food & Beverage Manufacturing

Chemical (Pharmaceutical Manufacturing)
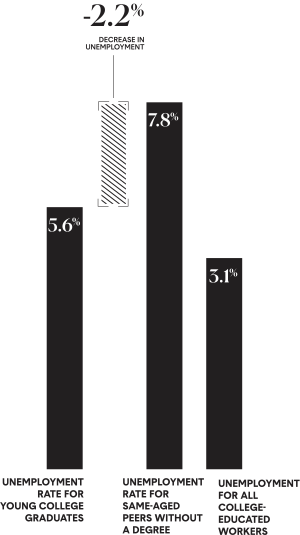
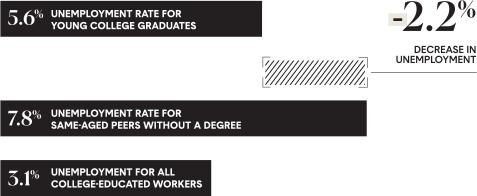
The college degree makes a difference
Young college graduates faced a 5.6% unemployment rate as of December 2025—higher than the 3.1% for all college-educated workers, but meaningfully lower than the 7.8% facing their same-aged peers without a degree. ¹⁶

2
SECTION 2
Are we impacting more students while maintaining program quality?
Over 17,000 Braven Fellows served nationwide to date

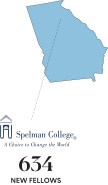
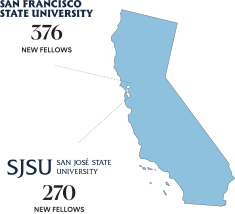
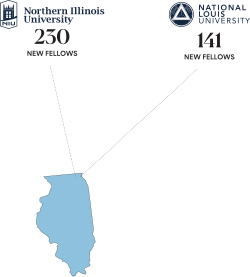
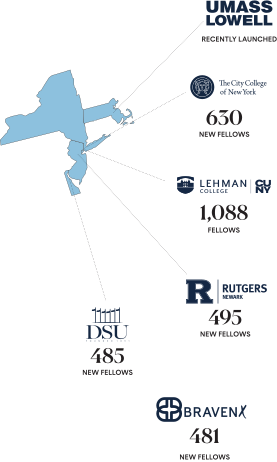
3,818
Braven Fellows supported nationwide during the 2025-2026 school year.
2025-2026 BravenX Fellows
481 Fellows completed the BravenX course in the 2025-2026 school year.
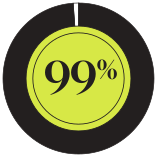
Course pass rate
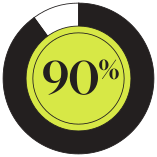
Average final grade
2025-2026 Fellows are:
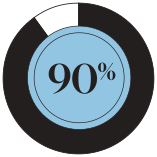
Students with limited financial resources
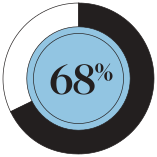
First-generation college students
79%
of Fellows who take the Braven Accelerator Course feel Braven has improved their chances of landing a job a great deal or quite a bit.
65
A widely used customer satisfaction metric on a scale of -100 to 100 that measures how likely a Fellow would recommend Braven to a friend. Above 0 is good, above 20 is favorable, and above 50 is excellent.
TOP 5 MAJORS

Psychology

Computer Science

Biology

Nursing

Finance

3
SECTION 3
Are we supporting Fellows to secure internships and complete college?
National Statistics
National Statistics
Quality internships during college make a difference
Internships are a critical piece of the college-to-career journey, but the quality of internships matters.
According to National Association of Colleges and Employers, students who take part in a paid internship secure more job offers and earn more than those who participate in unpaid internships. ¹⁷
AVERAGE STARTING SALARIES:
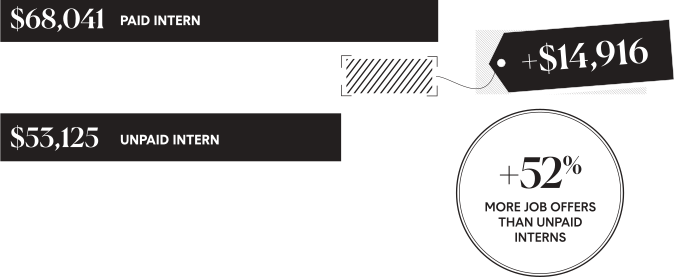
Additionally, those who participated in experiential learning experiences reported faster than expected career progression and higher rates of career satisfaction. ¹⁷


Encouraging levels of internship attainment for BravenX Fellows
For college students, internships serve as critical proof points of experience that open professional doors.
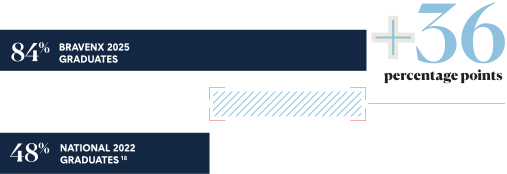
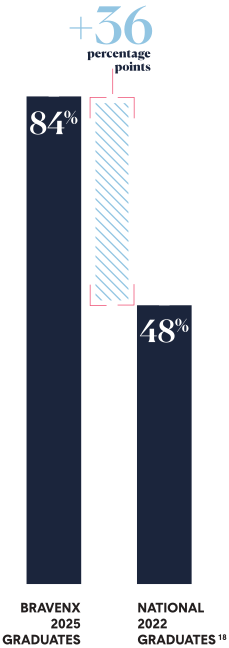
Compared with graduates nationally, BravenX 2025 graduates were 36 percentage points more likely to have at least one internship during their college experience.
The Braven experience drives meaningful increases in internship attainment
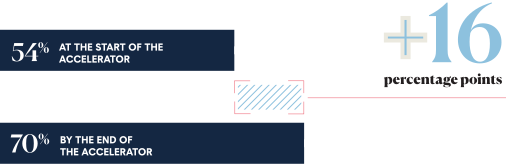
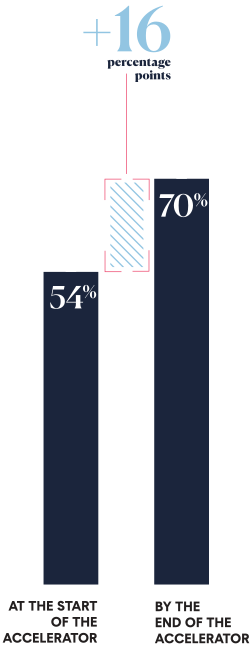
In the 2025-2026 school year, BravenX Fellows saw a 16 percentage point uplift in internship attainment between the start and end of the Accelerator course, speaking to an important element of the immediate impact of the Braven experience.¹⁹
Internships are a key step toward strong career outcomes.
Fellows who had at least one internship
Cook County Department of Human Rights and Ethics
Encouraging levels of graduation
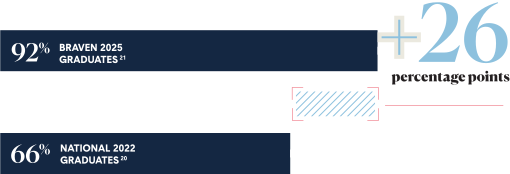
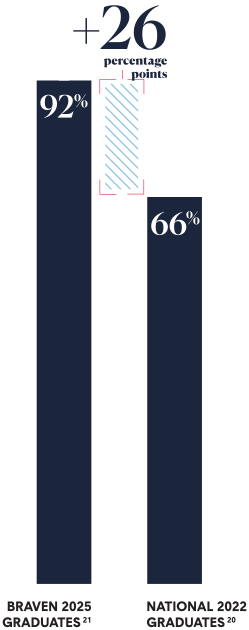
Nationally, only about 7 in 10 students graduate within six years of college enrollment.²⁰
Braven Fellows nationally, who typically join us during their sophomore or junior year, are graduating at encouraging rates.
Braven Fellows nationwide achieved a 92% six-year on-time graduation rate.²¹

4
SECTION 4
Are our Fellows developing the career readiness skills, networks, and confidence needed for success?
Growth in career-readiness skills
The Braven experience focuses on the following seven career-readiness skills:
• Career navigation
• Teamwork
• Organization
• Communication
• Leadership
• Problem-solving
• Technology
Why these career-readiness skills? They are:
1
Grounded in what research says is needed to successfully secure a strong first opportunity
2
In high-demand from employers. However, employers report recent graduates have not sufficiently developed these skills
3
Aligned with other career-readiness frameworks such as the National Association of Colleges and Employers (NACE) career-readiness competencies and the Association of American Colleges and Universities (AAC&U)'s VALUE rubrics
In 2025-2026, BravenX Fellows achieved an average final grade of 90%, demonstrating strong career-readiness skill mastery.
• Reflects on strengths, values, and interests
• Explores multiple career options
• Takes career actions such as making plans, creating a portfolio, and building networks
• Presents ideas clearly and purposefully
• Listens actively to understand and asks questions
• Demonstrates empathy and respect
• Works effectively towards shared goals
• Navigates differences
• Holds self and others accountable for deliverables
• Leads from values
• Grounds in purpose and assets
• Learns continuously from feedback and reflection
• Evaluates the ethical considerations of GenAI to guide its use
• Explores and applies GenAI strategies in the career-navigation process
• Develops proficiency with essential technological tools in your desired career field
• Defines the problem and identifies root causes
• Designs potential solutions
• Tests and implements solutions
• Plans and prioritizes tasks
• Monitors progress and adjusts when faced with challenges
• Gets things done
Networks and social capital
Extensive research has illustrated the importance of networks and social capital in career navigation and success.²²
Braven supports students to build strong networks by connecting students to professionals and helping students build the skills necessary to mobilize those networks to advance their career goals.
To measure students’ networking skills and how they activate their social capital, we leverage resources from the Search Institute.
In the 2025-2026 school year, BravenX Fellows showed statistically significant growth ²³ across all the following measures:
+31
NETWORKING SELF-EFFICACY
The degree to which an individual purposefully uses relationships within their social network to reach their goals.
+31
SELF-INITIATED SOCIAL CAPITAL
Refers to the degree to which an individual actively builds relationships and uses the relationships and the resources they have to reach their goals.
Growth in Confidence Measures: Self-Efficacies
Each semester, Braven measures growth in self-efficacies from the start to the end of the Braven Accelerator.
Self-efficacy is a person’s belief in their ability to succeed in various situations and is associated with academic and lifetime success. It is not typically measured through traditional assessments like standardized tests, but plays a large role in explaining job search, career search behaviors, and career outcomes.
In the 2025-2026 school year, Braven Fellows showed statistically significant growth in Job-Search Self-Efficacy and Career Self-Efficacy. 23
+56
JOB-SEARCH SELF-EFFICACY
Refers to students’ confidence in their ability to successfully complete the steps of the job search process.
+24
CAREER SELF-EFFICACY
The degree to which an individual feels they can successfully reach their career goals.

5
SECTION 5
Are we building employer and higher education partnerships with true shared value?
Employer spotlight:
Teach For America
Braven’s collaboration with Teach For America (TFA) helps open doors to the American Dream while also ensuring their alumni and staff stay proximate to the communities they care about and continue to develop leadership skills as they advance in their careers.
TFA Employee & Alumni Volunteerism during the 2025-2026 school year
7
LEADERSHIP COACHES
14
PROFESSIONAL MENTORS
28
MOCK INTERVIEWERS
~900
VOLUNTEER HOURS
Building the pipeline during the 2025-2026 school year
38
2026 BRAVEN GRADUATES ACCEPTED INTO THE TFA CORPS
20
BRAVEN FELLOWS IN COLLEGE ACCEPTED INTO TFA IGNITE
Programmatic highlights from the 2025-2026 school year
Capstone Challenge sponsor
Teach For America’s Reinvention Lab served as a Capstone Partner for BravenX in Spring 2026, asking Fellows to explore how young people can showcase digital media skills.
8
EVENTS CO-HOSTED FOR BRAVEN FELLOWS
“At Teach For America, we know that the future of this country depends on who has access to opportunity, and Braven is getting that right. The talent that comes through Braven’s programs is remarkable: driven, prepared, and deeply committed to making a difference in their communities. Their work is not just developing the next generation of professionals; it’s building the next generation of leaders our nation needs.”
— Aneesh Sohoni
Chief Executive Officer, Teach For America

2025-2026 Braven National Faculty Council
The Braven National Faculty Council is a distinguished collective of faculty leaders from Braven's partner institutions.
Faculty have deeply informed our model from the start. Launched in FY25, the Council formalized that engagement, bringing educators' voices directly into the evolution of our curriculum. In its second year, the Council expanded to include participation across eight of our partner institutions and deepened its impact—delivering substantive guidance on AI ethics and Capstone design, and strengthening alignment between the Capstone Challenge and AAC&U's high-impact practices.
City College of New York
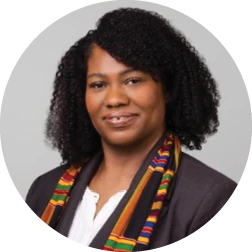
Naomi Nwosu-Stewart
Assistant Vice President of Enrollment Management
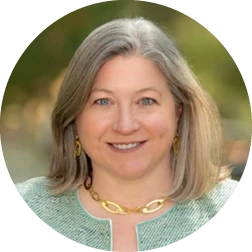
Renata Miller
Dean of the Division of Humanities and the Arts & Professor of English
Delaware State University
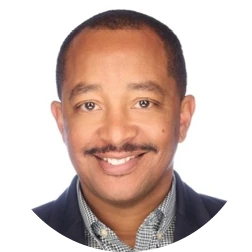
Kimeu Boynton
Associate Professor in Sociology and Criminal Justice & Interim Assistant Dean of the College of Humanities, Education, and Social Sciences
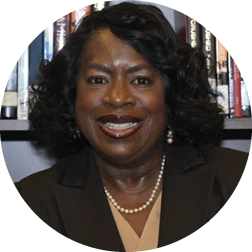
Phyllis Brooks Collins
Founding Program Director and Assistant Professor for the Integrated Studies Program
National Louis University
David O'Neale Corbin Jr.
Senior Student Success Coach
Natasha Kohl
Director of the Undergraduate Honors Program & Director of the University Writing Initiative

Uzoma Obidike
Director and Assistant Professor of Undergraduate Career Development
Spelman College

Anastasia Valecce
Associate Professor of Spanish (Hispanic Studies)
Northern Illinois University

Alicia Schatteman
Vice Provost for Academic Affairs & Professor
Andrea Radasanu
Director of the University Honors Program, Assistant Vice Provost for Student Enhancement
Rutgers University-Newark
Hyacinth Miller
Assistant Teaching Professor in the Departments of Africana Studies and Political Science & Study Abroad Director
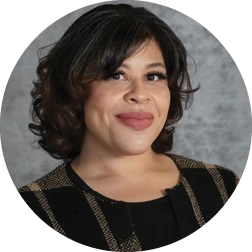
Kaleena Rogers
Associate Director of Practicum Education
San José State University

Mary Currin-Percival
Associate Professor of Political Science; Director, Institute for Public Affairs and Civic Engagement (IPACE); Founding Director, SJSU Votes
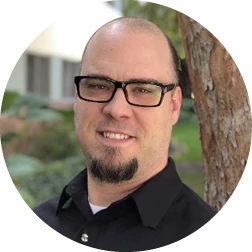
Ryan Skinnell
Professor of Rhetoric & Writing; Director of First-Year Writing
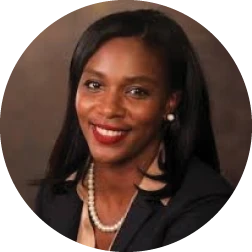
Yolanda Wiggins
Assistant Professor in the Department of Sociology & Interdisciplinary Social Sciences
San Francisco State University
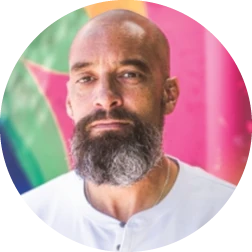
Jeff Duncan-Andrade
Professor of Latina/o Studies and Race and Resistance Studies; Founder of the Roses in Concrete Community School
Higher Education Partners
Chicago State University
City College of New York
Delaware State University
Illinois Institute of Technology (launched Fall 2026)
Kean University (launched Fall 2026)
University of Mount Saint Vincent (launched Fall 2026)
National Louis University
Northern Illinois University
Rutgers University-Newark
San Francisco State University
San José State University
Spelman College
The University of Massachusetts Lowell
University of North Texas
BRAVENX PARTNERS
Academy Charter High School
Achieve Atlanta
Associated Colleges of Illinois
At The Table NYC
Augustana College
Birmingham Promise
CARA NYC
Camino Nuevo Charter Academy
Carmen Schools of Science & Technology
Chicago Scholars
City Year
Common Ground Foundation
Coney Island Prep Public Schools
Cooperman College Scholars
Cristo Rey Network
Daniel Murphy Scholarship Fund
Delta Sigma Phi
Dream Charter School
Eagle Academy Foundation
East Harlem Tutorial Program
El Dorado Promise
Eureka College
Excel Academy Charter School
Excellence Community Schools
Fidelity Scholars
Hendrix College
Horatio Alger Association
IDEA Public Schools
Illinois College
KIPP Forward (Post-Secondary Success Collaborative)
KIPP Massachusetts
Knox College
LISA Academy
Meeting Street Scholarship Fund
Millikin University
North Central College
Prospect Schools
Quincy University
Rivet School
Rockford University
SEEDS
The Noble Network of Charter Schools
The Wight Foundation
Tulsa Honor Academy
Uncommon Schools
University Settlement
Uplift Education
UtmostU
Employer Partners
LEAD
($250K+ and programmatic support)
Apollo Opportunity Foundation
Barclays
Blackstone Charitable Foundation
Capital One
Deloitte
JPMorgan Chase Foundation
Morgan Stanley
NBA Foundation
Prudential Foundation
ANCHOR
($100K+ and programmatic support)
Allstate
Atlassian
Brooks Brothers & The Golden Fleece Foundation
CIBC Foundation
Cognizant US Foundation
The College Board
KEYSTONE
($25K+ and programmatic support)
Audible
Berkshire Hathaway Specialty Insurance
Blackbaud
CBRE
Charles Schwab
CME Foundation
Cornerstone Outreach
Goldman Sachs
Nerdwallet
Northern Trust
nvp
Panasonic North America
Pathward N. A.
PwC
Ripple
Scotiabank
Silver Lake
Synchrony Financial
Taco Bell Foundation
UBS
INNOVATION
($10K+ and programmatic support)
Anonymous
Mars Wrigley
M&T Bank
Neuberger Berman
IMPACT
($5K+ and/or programmatic support)
1Huddle
Bay FC
Brown Advisory
Carvertise
Catalina
Chicago Sky Foundation
Choose New Jersey
Cisco
City Year
Code Differently
Cortaditos
Cramer-Krasselt
Devil’s Youth Foundation
Enkeya.ai
Equal Space
Exelixis
Georgia-Pacific
Goodman Theater
Graham Windham
Hacker Dojo
Harris Blitzer Sports & Entertainment
Hispanic Foundation of Silicon Valley
Horizon Blue Cross Blue Shield of New Jersey
Incyte Charitable Giving Foundation
IQVIA
Jacobs Levy Equity Management
Kindle Communications
L’Oreal
Medline
Metro Atlanta Chamber
Micron Technology, Inc.
National Black Arts Festival
NetApp
NJPAC
Northwestern Medicine
Oakland Roots SC
Old National Bank
On Target Supplies & Logistics
Philadelphia 76ers
Randstad
San Francisco Chamber of Commerce
San Francisco Public Library
San Francisco Giants
SAP Americas
Staffmark
Student Leadership Network
Sutter Health
Teach For America
Texas Instruments
The California Community Colleges’ Digital Center
The Clorox Company
Unacast
Visa
Wells Fargo
Wu Yee Children’s Services
Young Invincibles
Philanthropic Supporters ($10k+)
A Better Chicago Fund, a Fund of the Robert R. McCormick Foundation
Abrams Foundation
Akila Grewal
Allan & Gill Gray Philanthropies
Andrew Carnegie Foundation
Anonymous (x11)
Arbor Rising
Arrow Impact
Arthur & Toni Rembe Rock
Axim Collaborative
Ballmer Group
Blue Meridian Partners
Carroll and Milton Petrie Foundation
Charles & Helen Schwab Foundation
Charles Ashby Lewis & Penny Bender Sebring
Charles Hayden Foundation
Charter School Growth Fund
Chicago Community Trust
College Futures Foundation
Cousins Foundation
Crankstart Foundation
Crown Family Philanthropies
David Cohen & Kristen Argo
Deloitte Foundation
D’Lovely Gibson
Ellie’s Foundation Fund
Finnegan Family Foundation
Geraldine R. Dodge Foundation
Give for the Future Fund
Give Forward Foundation
Grace & Steve Voorhis
Gray Foundation
Harriet Watkins
Impact100 Essex
Irene Esteves
James Ely
Joe & Cheryl Della Rosa
Joseph Schwartz
John & Wendy Cozzi
John Matthew Sobrato & Andie Sobrato
Julie & Greg Flynn
Ken Ohashi & Adam Freed
Leon & Toby Cooperman Family Foundation
Linda & Brian Sterling
Lindmor Fund
Lisa & Joseph Amato
Longwood Foundation
Lynn & Sengal Selassie
MacKenzie Scott
M&T Weiner Foundation
Mansueto Foundation
Marc and Jeanne Malnati Family Foundation
McCance Family Foundation
Michael & Susan Dell Foundation
Molly Blank Fund of the Arthur M. Blank Family Foundation
MR Macgill
New Profit, Inc.
Osa Foundation
Paul M. Angell Family Foundation
Paula Sneed & Lawrence Bass
Prosper Road Foundation
Rachel Kohler
René Kern
Ron & Kathy Sonenthal
Sarah Peter
Schreiber Philanthropy
Schultz Family Foundation
Shellye Archambeau
Siegel Family Endowment
Sobrato Family Foundation
Square One Foundation
Steve & Sue Mandel
Stupski Foundation
Susan & Thomas Dunn
Susan Grant
Tammy & Bill Crown
The Barberry Foundation
The Berghorst Foundation
The Boston Red Sox Foundation
The Cargill Foundation
The Carson Family Charitable Trust
The Cleveland Avenue Foundation for Education
The Gilliam Foundation
The Harnisch Foundation
The Ichigo Foundation
The Jeffrey H. and Shari L. Aronson Family Foundation
The Joseph Pedott Charitable Fund at The Chicago Community Foundation
The Laurie M. Tisch Illumination Fund
The Mayer and Morris Kaplan Family Foundation
The MCJ Amelior Foundation
The Mellen Charitable Foundation
The Walton Family Foundation
Tipping Point Community
Tony Abbiati and Alicia Collins
Valhalla Foundation
Vivo Foundation
William and Charlene Glikbarg Foundation
Younger Family Fund
A big thank you to our National Board of Directors:
Shellye Archambeau
Richard Barth
Phillip L. Clay
John F. Cozzi
Susan Dunn
Irene Esteves
David S. Levy
Shalinee Sharma
Elizabeth Thompson
Harry L. Williams
Charlie Wolfson
ENDNOTES
1. 17,404 Fellows have completed the Braven Accelerator course to date; this includes core sites from FY2026 (BravenX, City College of New York, Delaware State University, Northern Illinois University, Rutgers University-Newark, San Francisco State University, San Jose State University, and Spelman College) and non-core sites (National Louis University, University of Massachusetts Lowell, and University of North Texas).
2. The percentage of students not on the path to the American Dream is an estimate of the percentage of Pell-Grant or first-generation students who have graduated but have not secured a quality job post college. This cohort is based on the latest data available and is the total fall 2022 enrollment of first-time degree/certificate-seeking students in degree-granting postsecondary institutions (NCES 2023 Digest of Education Statistics table 305.10) and the total fall 2021 enrollment of 2YR > 4YR transfers (NSC Research Center Fall 2023 Transfer and Progress Report). Based on this cohort, the percent of students not on path to the American Dream is calculated leveraging the following sources: “Percentage of Undergraduates Receiving Pell Grant in 2022-2023” NCES 2023 IPEDS Trends Generator; “Number of Full-Time, First-Time Degree/Certificate-Seeking Undergraduate Students... by Type of Aid Received” NCES 2020 IPEDS Data Explorer table 20; “Total Undergraduate Fall Enrollment in Degree-Granting Postsecondary Institutions, by Attendance Status, Sex of Student, and Control and Level of Institution: Selected Years, 1970 through 2031” NCES 2023 Digest of Education Statistics table 303.70; Trends in first-generation Students: College Access, Persistence, and Postbachelor’s Outcomes NCES 2018 First Generation Students Report; Trends in Pell Grant Receipt and the Characteristics of Pell Grant Recipients: Selected Years, 2003–2004, 2015–2016 NCES 2019 IPEDS Trends Generator; NACE 2025 First Destination Survey and September 2025 Federal Reserve Bank of New York Underemployment Rate.
3. Blankenship, Molly, et al. The American Job Quality Study: 2025 State of the U.S. Labor Force. Jobs for the Future / Families and Workers Fund / Gallup, Oct. 2025, https://www.jff.org/wp-content/uploads/2025/10/AmericanJobQualityReport_Final_10142025.pdf. Accessed 24 Feb. 2026. For the accompanying graph, a quality job is defined as one that allows workers to meet their basic financial needs, feel safe and respected, grow their skills, have a voice in decisions that affect them, and exercise some control over their time and work.
4. Morris, Catherine, et al. The Major Payoff: Evaluating Earnings and Employment Outcomes Across Bachelor’s Degrees. Georgetown University Center on Education and the Workforce, 2025, cew.georgetown.edu/major-payoff. Accessed 24 Feb. 2026.
5. Kessler, Sarah. “The Rise of the Robot Job Seeker.” The New York Times, 21 June 2025, https://www.nytimes.com/2025/06/21/business/dealbook/ai-job-applications.html. Accessed 24 Feb. 2026.
6. Job Outlook 2025. National Association of Colleges and Employers, Jan. 2025, https://naceweb.org/docs/default-source/default-document-library/2025/publication/research-report/2025-nace-job-outlook-jan-2025.pdf. Accessed 24 Feb. 2026.
7. Braven defines quality outcome attainment using the following methodology:
a. Quality outcome: Fellow enrolls in graduate school or secures a job that requires a BA/BS, is full-time, and is paid.
b. Part-quality outcome: Fellow secures a job that is paid, aligns with long-term career interests, and meets at least one of the criteria below:
i. Requires a bachelor’s degree
ii. Is full-time
iii. Offers employer-provided benefits
iv. Earns >35k per year
v. Builds record of achievement/resume
vi. Builds transferable skills, especially within career interests
c. Not quality: Fellow secures a job that is paid, but does not meet the criteria of a part-quality or quality job.
d. Unemployed: Fellow is unemployed.
8. 51% is the percentage of BravenX Fellows who secured a quality job or enrolled in graduate school. All outcome percentages are based on Fellows for which their post-graduation outcome is known (70% or 209 out of the total 298 BravenX graduates in FY2025 has a known outcome).
9. Braven’s 45% peer benchmark is calculated by taking the NACE 2024 full-time employment rate for students at institutions with a high concentration of Pell Grant recipients (40-60%) from the NACE 2025 First Destination Survey, adjusting it for underemployment (using Federal Reserve of New York and U.S. Census data), and adding the percentage of students pursuing graduate school education.
10. Braven’s 49% national benchmark is calculated by taking the NACE 2024 full-time employment rate from the NACE 2025 First Destination Survey, adjusting it for underemployment (using Federal Reserve of New York and U.S. Census data), and adding the percentage of students pursuing graduate school education.
11. Low-income is defined as whether the student is Pell-eligible as determined by partner college roster files or Braven Fellow self-report data.
12. First-generation is defined as the Braven Fellow identifying as a student who is the first in their immediate family to attend or graduate from a four-year college or university.
13. 27% is the percentage of Fellows who enrolled in graduate school. This percentage is based on Fellows for which their post-graduation outcome is known (87% or 1136 out of the total 1306 graduates at FY2025 core sites’ has a known outcome).
14. National Student Aid Profile: Overview of 2024 Federal Programs. National Association of Student Financial Aid Administrators, 2024, https://www.nasfaa.org/uploads/documents/2024_National_Profile.pdf. Accessed 24 Feb. 2026.
15. Job Outlook 2026: Spring Update. National Association of Colleges and Employers, Apr. 2026, https://naceweb.org/docs/default-source/default-document-library/2026/publication/research-report/2026-job-outlook-report-spring-update.pdf. Accessed 25 July 2026.
16. The Labor Market for Recent College Graduates. Federal Reserve Bank of New York, https://www.newyorkfed.org/research/college-labor-market#--:explore:unemployment. Accessed 25 July 2026.
17. The 2024 Student Survey Report, Four-Year Schools: Executive Summary. National Association of Colleges and Employers, Sept. 2024, https://naceweb.org/docs/default-source/default-document-library/2024/publication/executive-summary/2024-nace-student-survey-executive-summary-four-year.pdf. Accessed 25 July 2026.
18. Clayton, Dave, et al. From College to Career: Students’ Internship Expectations and Experiences. Strada Education Foundation, 17 May 2023, https://www.strada.org/reports/from-college-to-career-students-internship-expectations-and-experiences. Accessed 24 Feb. 2026.
19. Change in internship attainment is measured by the percentage of students who self-reported at least one internship at the beginning of the Braven course on the pre-accelerator survey and comparing it to the percentage of students who self-reported at least one internship at the end of the Braven course on the post-accelerator survey.
20. The National Comparison represents the six-year graduation rate for the 2018 cohort of full-time, first-time Pell Grant recipients at four-year public Title IV institutions. This rate is adjusted to account for year-over-year persistence from freshman through junior year. Data is synthesized from the NCES IPEDS Data Explorer (2024), the Digest of Education Statistics (2021), and American Institutes for Research (2023).
21. Six-year graduation rate of Braven Fellows includes students who enrolled as first-time freshmen at SJSU and RU-N, not including those who took Braven as seniors, transfers, or international students. SJSU and RU-N are the only FY2025 core sites included in the six-year graduation rate calculation because they have reached a threshold of graduates to date (200+) for which we have both valid enrollment and graduation data.
22. Boat, A. A., Syvertsen, A. K., & Scales, P. C. (2021). The role of social capital in promoting work readiness among opportunity youth. Children and Youth Services Review, 131, 106270. https://doi.org/10.1016/j.childyouth.2021.106270
23. Search Institute (2021). Social capital assessment and learning for equity measures: User manual. Minneapolis, MN: Search Institute.

